Madelaine Prince (Research)
Priyal Mehta (Research & Graphic Design)
Silvana N.S. (Research, Graphic Design & Illustrator)
Sourena Nakghikhani (Research & Interaction Design)
This project was created as part of OCAD U's Understanding Systems course. Our goal was to gain a deep understanding of the potential for regenerative tourism in Ontario's Niagara Region. We focused on the environmental impacts of the tourism sector, exploring how we can pave the way for a future of regenerative tourism. The synthesis map explore the following research question: how might we understand the environmental impacts of the tourism industry in the Niagara Region, with consideration for a future of regenerative tourism?
As graduate students coming from different parts of the world, we acknowledge that we are outsiders to the Niagara community. We understand that our perspectives may have limitations in fully grasping the intricacies of the systems we study. The synthesis map and report we present are based on secondary research and our personal observations, which naturally have their constraints. To achieve a more comprehensive and meaningful systems understanding, genuine collaboration and co-design with the local community would be essential throughout the design process. We recognize the importance of engaging and involving the community to create a more inclusive and informed project outcome.

The Niagara Region is a regional municipality in Ontario, Canada, located between the northeastern end of Lake Erie and the southwestern end of Lake Ontario. The Niagara Region is comprised of 12 municipalities, including Fort Erie, Grimsby, Lincoln, Niagara-on-the-Lake, Niagara Falls, Pelham, Port Colborne, St. Catharines, Thorold, Wainfleet, Welland, and West Lincoln.
A 2021 census from the Government of Canada indicated 484,000 residents living in the region (Niagara Region, 2022). The primary economic sectors in the region include tourism, agriculture, and manufacturing (Niagara Economic Development, 2023). A technology-based sector is also emerging. The region hosts approximately 13 million visitors each year (Niagara Economic Development, 2023).
The most well-known feature of the region is the Niagara Falls, which is a natural waterfall along the Niagara River. The falls are located in the municipality of Niagara Falls. The Niagara Region is also famous for its vineyards and wine, performing arts, golf courses, as well as the largest casino in Canada (Niagara Economic Development, 2023). The Niagara Region consists of many parks, protected areas, and recreational trails.
In selecting the focus area, we were drawn to Niagara Region's reputation for its rich biodiversity and vast natural resources. The allure of Niagara's natural beauty, combined with the fact that tourism serves as the leading economic sector in the area, made it a compelling subject for our exploration.
Understanding the environmental impacts of tourism in Niagara became a focal point for our qualitative economic sector analysis. We recognized that tourism's influence on the region's delicate ecosystem and natural assets could have significant implications for its sustainability and future development. By delving into this aspect, we aimed to shed light on the importance of responsible tourism practices and the potential for regenerative tourism in the region.
The map is limited to Niagara Falls and Niagara on the Lake as the main tourist destinations in the region.
We introduce the main actors in the tourism industry, as identified in the actors map.


In order to provide a relatable and accessible way to discuss complex environmental issues, the synthesis map is framed in a journey of a family of four, consisting of two parents and two children, through multiple touch points within Niagara tourism ecosystem, to help contextualize the impact of human activities on the environment, and to make the story feel more tangible and comprehensive for readers. It allows for a broader discussion of tourism's environmental impact beyond a single location.
The touch points included in the synthesis map are typical attractions in the Niagara Falls and Niagara-on-The-Lake with a typical family would experience over a weekend in Niagara.
We took into consideration the common mode of transport used by the family such as:
There are Within this version of the map, we use the most accessible data to both the readers and the team as the parameters to determine the environmental impacts:
The three days and two nights itinerary represent a typical long weekend timeline for a family getaway, and these activities were selected based on research which indicated that these activities were some of the most popular local activities for tourists during peak season.

To understand the environmental impact of tourism, our team used an environmental systemigram taken from United Nations Environment Programme’s tourism framework (United Nations Environment Programme) as seen bellow and extensively researched each activity. We looked into things like resource usage, pollution emissions, waste generation, and habitat destruction caused by these activities.
.jpeg)
Next, we wanted to show the overall impact of all activities in a simple way. So, we found common impacts among them and combined them into a single numerical value. This made it easier for people to grasp and take actions to reduce these impacts. However, we faced some challenges due to limited data access. We had to make assumptions to estimate missing values, making our numbers less precise. Also, since environmental impacts are complex and interconnected, it was tough to quantify them accurately within a specific region. Instead, we focused on telling a story through our approach. To make the information more relatable, we scaled the numbers to the population of Niagara Falls (over 37,000 households). This way, the audience can better understand the total environmental impact in a context they can relate to. Our goal is to raise awareness and encourage positive change for a more sustainable future in Niagara.
In the map, we aimed to identify the individual impact of tourists and the cumulative impact that the tourism sector causes. Typical tourist attractions are often developed and managed by businesses, who have a responsibility to ensure that their operations are sustainable and to minimize their environmental impacts. In addition, governments have a responsibility of serving the local communities through economic and environmental management.
The synthesis map's narrative reveals the intricate web of environmental issues, showing how they go beyond affecting just one area and can have far-reaching consequences throughout the ecosystem. It emphasizes the power of individual choices and behaviors in shaping environmental impact. Readers are encouraged to reflect on their own actions, like transportation choices and use of disposable items, and consider positive changes for their families.
By examining data on attractions, we can hold businesses accountable for their environmental impact and push them towards more sustainable practices.
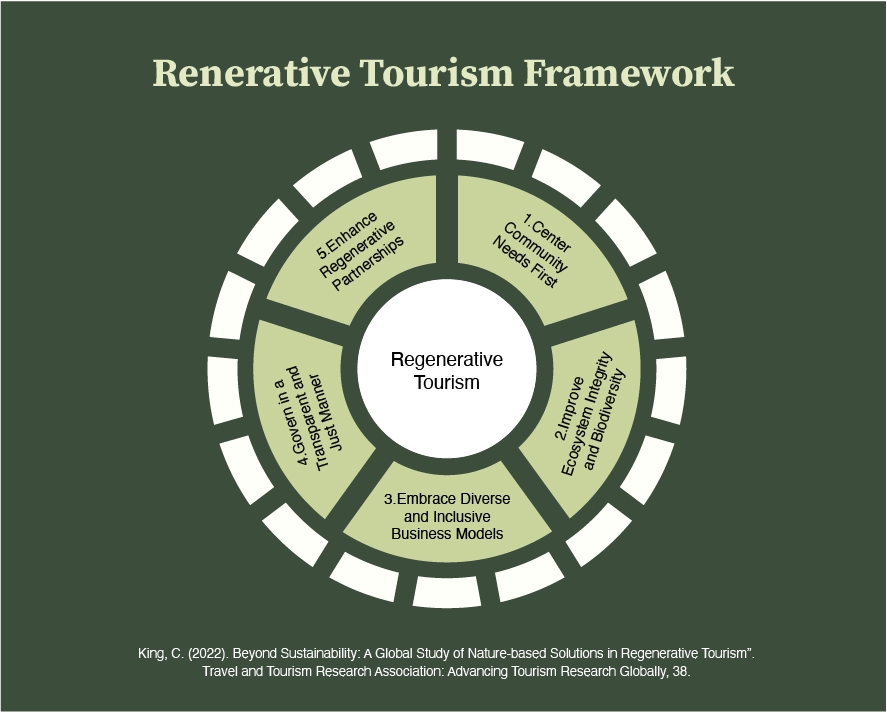
In Design Journeys through Complex Systems, Jones and Van Ael discuss strategy interventions, emphasizing leverage as a key factor for effective impact. Leverage is about achieving maximum desired effects with minimal energy inputs (Jones and Van Ael, 2022). Following this principle, our team employed the Intervention Strategy framework to create recommendations with potential incremental actions that can influence system conditions significantly.
Using the 12 leverage points, we explored numerous intervention opportunities based on our extensive research. Our aim is to implement interventions that can bring about meaningful change in the system.
Centering community needs first
Improving ecosystem integrity and biodiversity
Embracing diverse and inclusive business models
Governing in a transparent and just manner
Enhancing regenerative partnerships